Race intelligence platform From data to decision

DON’T JUST
WATCH THE
RACE.

See the race differently. Turn pace, form, strategy, tyre behaviour and circuit DNA into a prediction you can explain.

Live-ready 50+ signals 10 seasons
Formula 1 / speed / precision / prediction
FORMULA 1RACE INTELLIGENCETYRE DEGRADATIONSECTOR PACEQUALIFYING EDGESTRATEGY WINDOWS FORMULA 1RACE INTELLIGENCETYRE DEGRADATIONSECTOR PACEQUALIFYING EDGESTRATEGY WINDOWS
01 / Race weekend

THE
WEEKEND.

Think like the pit wall, not the scoreboard. A race is a sequence of changing conditions. This view makes the storyline visible from Thursday through Sunday.

Formula 1 inspired race circuit scene
Circuit profile
Round 12 · Zandvoort

FAST. NARROW. UNFORGIVING.

High-speed commitment, evolving grip and very little room to hide a weak setup.
Weekend pulse

SESSION RHYTHM

Friday
Practice → setup discovery
Long runs meet one-lap pace.
Saturday
Qualifying → track position
Every hundredth suddenly matters.
Sunday
Race → strategy unfolds
The model becomes a live story.
Open weekend dashboard
02 / Garage wall

INSIGHT
WITHOUT NOISE.

The visual language deliberately borrows from race engineering: dense when needed, quiet everywhere else. Numbers have hierarchy. Alerts have meaning. The eye gets the right information first.

Driver portrait placeholder
Driver profile
01 / MAX
Projected
P1
9.4
form index
race pace elite signal
Circuit DNA

PERFORMANCE RADAR

ZND-26
TOP SPEED DOWNFORCE TYRES BRAKING OVERTAKE
Track fit
9.1
High-speed circuit · heavy braking · medium tyre stress
Strategy board

TYRE WINDOWS

Soft → Medium BEST
S
M
Estimated pit window: lap 35–38
Medium → Hard STABLE
M
H
Estimated pit window: lap 41–45
Strategy alert

Track temperature may widen the medium tyre window. Monitor stint degradation before committing.

03 / Media wall

SEE THE
SPEED.

Prediction is not only numbers. Give the race atmosphere, motion and visual context — from pit lane theatre to the geometry of a circuit.

Motion study Video
Featured video

RACE AFTER DARK.

Replace the placeholder with your own race-film asset, YouTube embed or backend-powered media source.

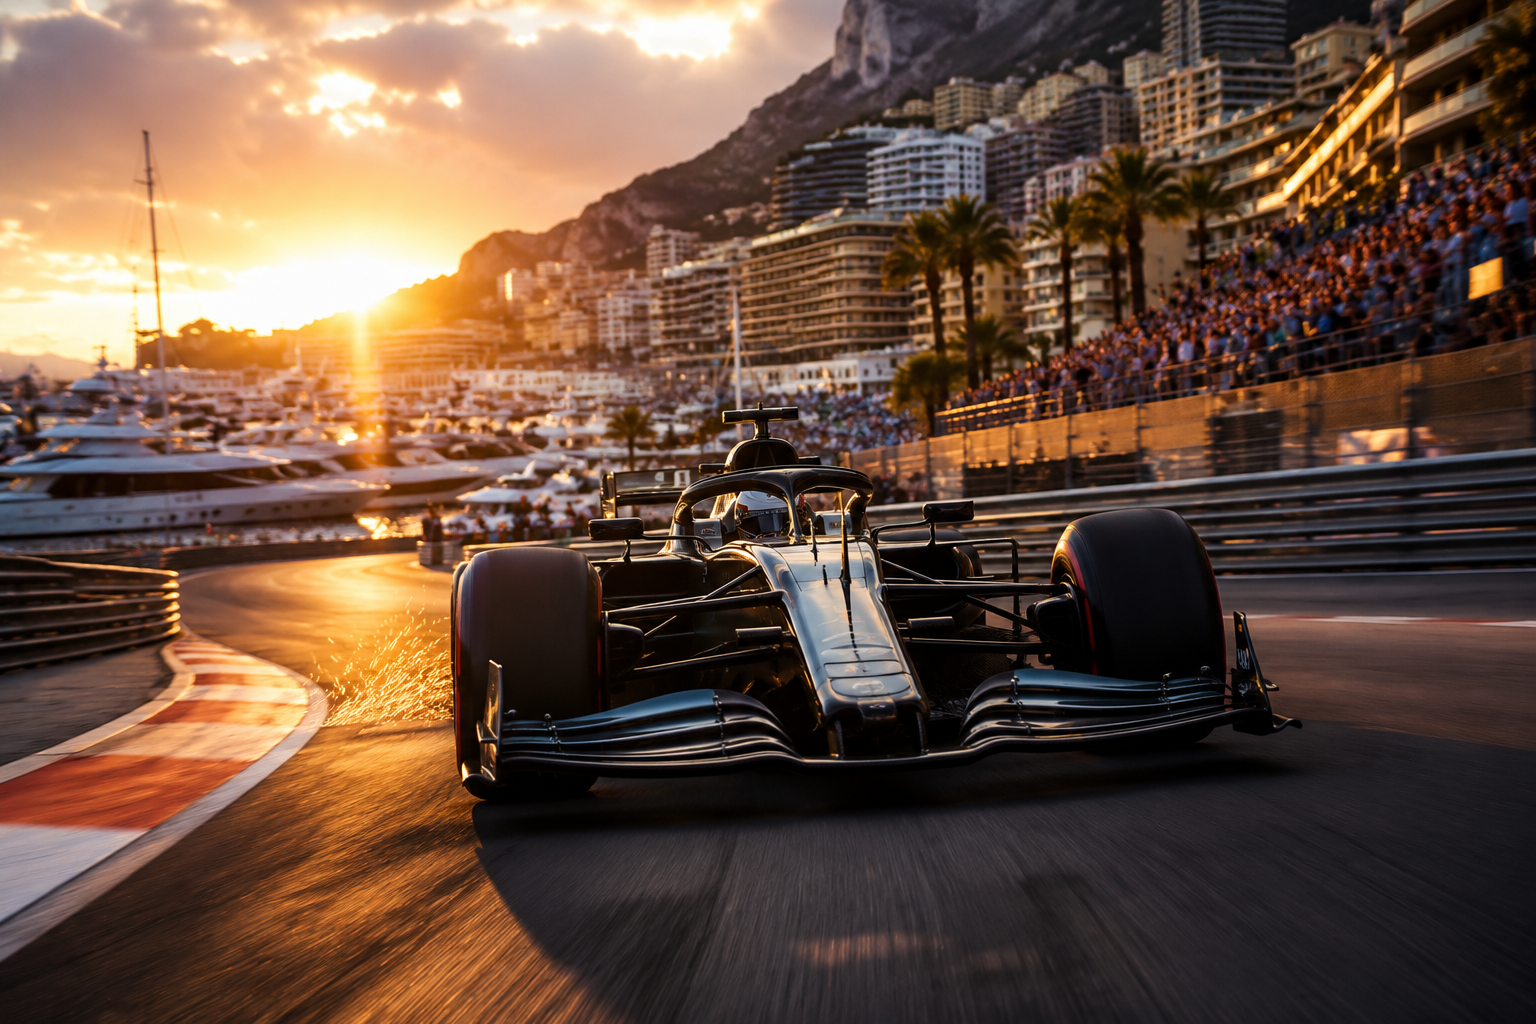
Track character

THE CORNER ENTRY.

Pit lane

TWO SECONDS.

04 / Image archive

THE
PADDOCK.

Browse dashboard
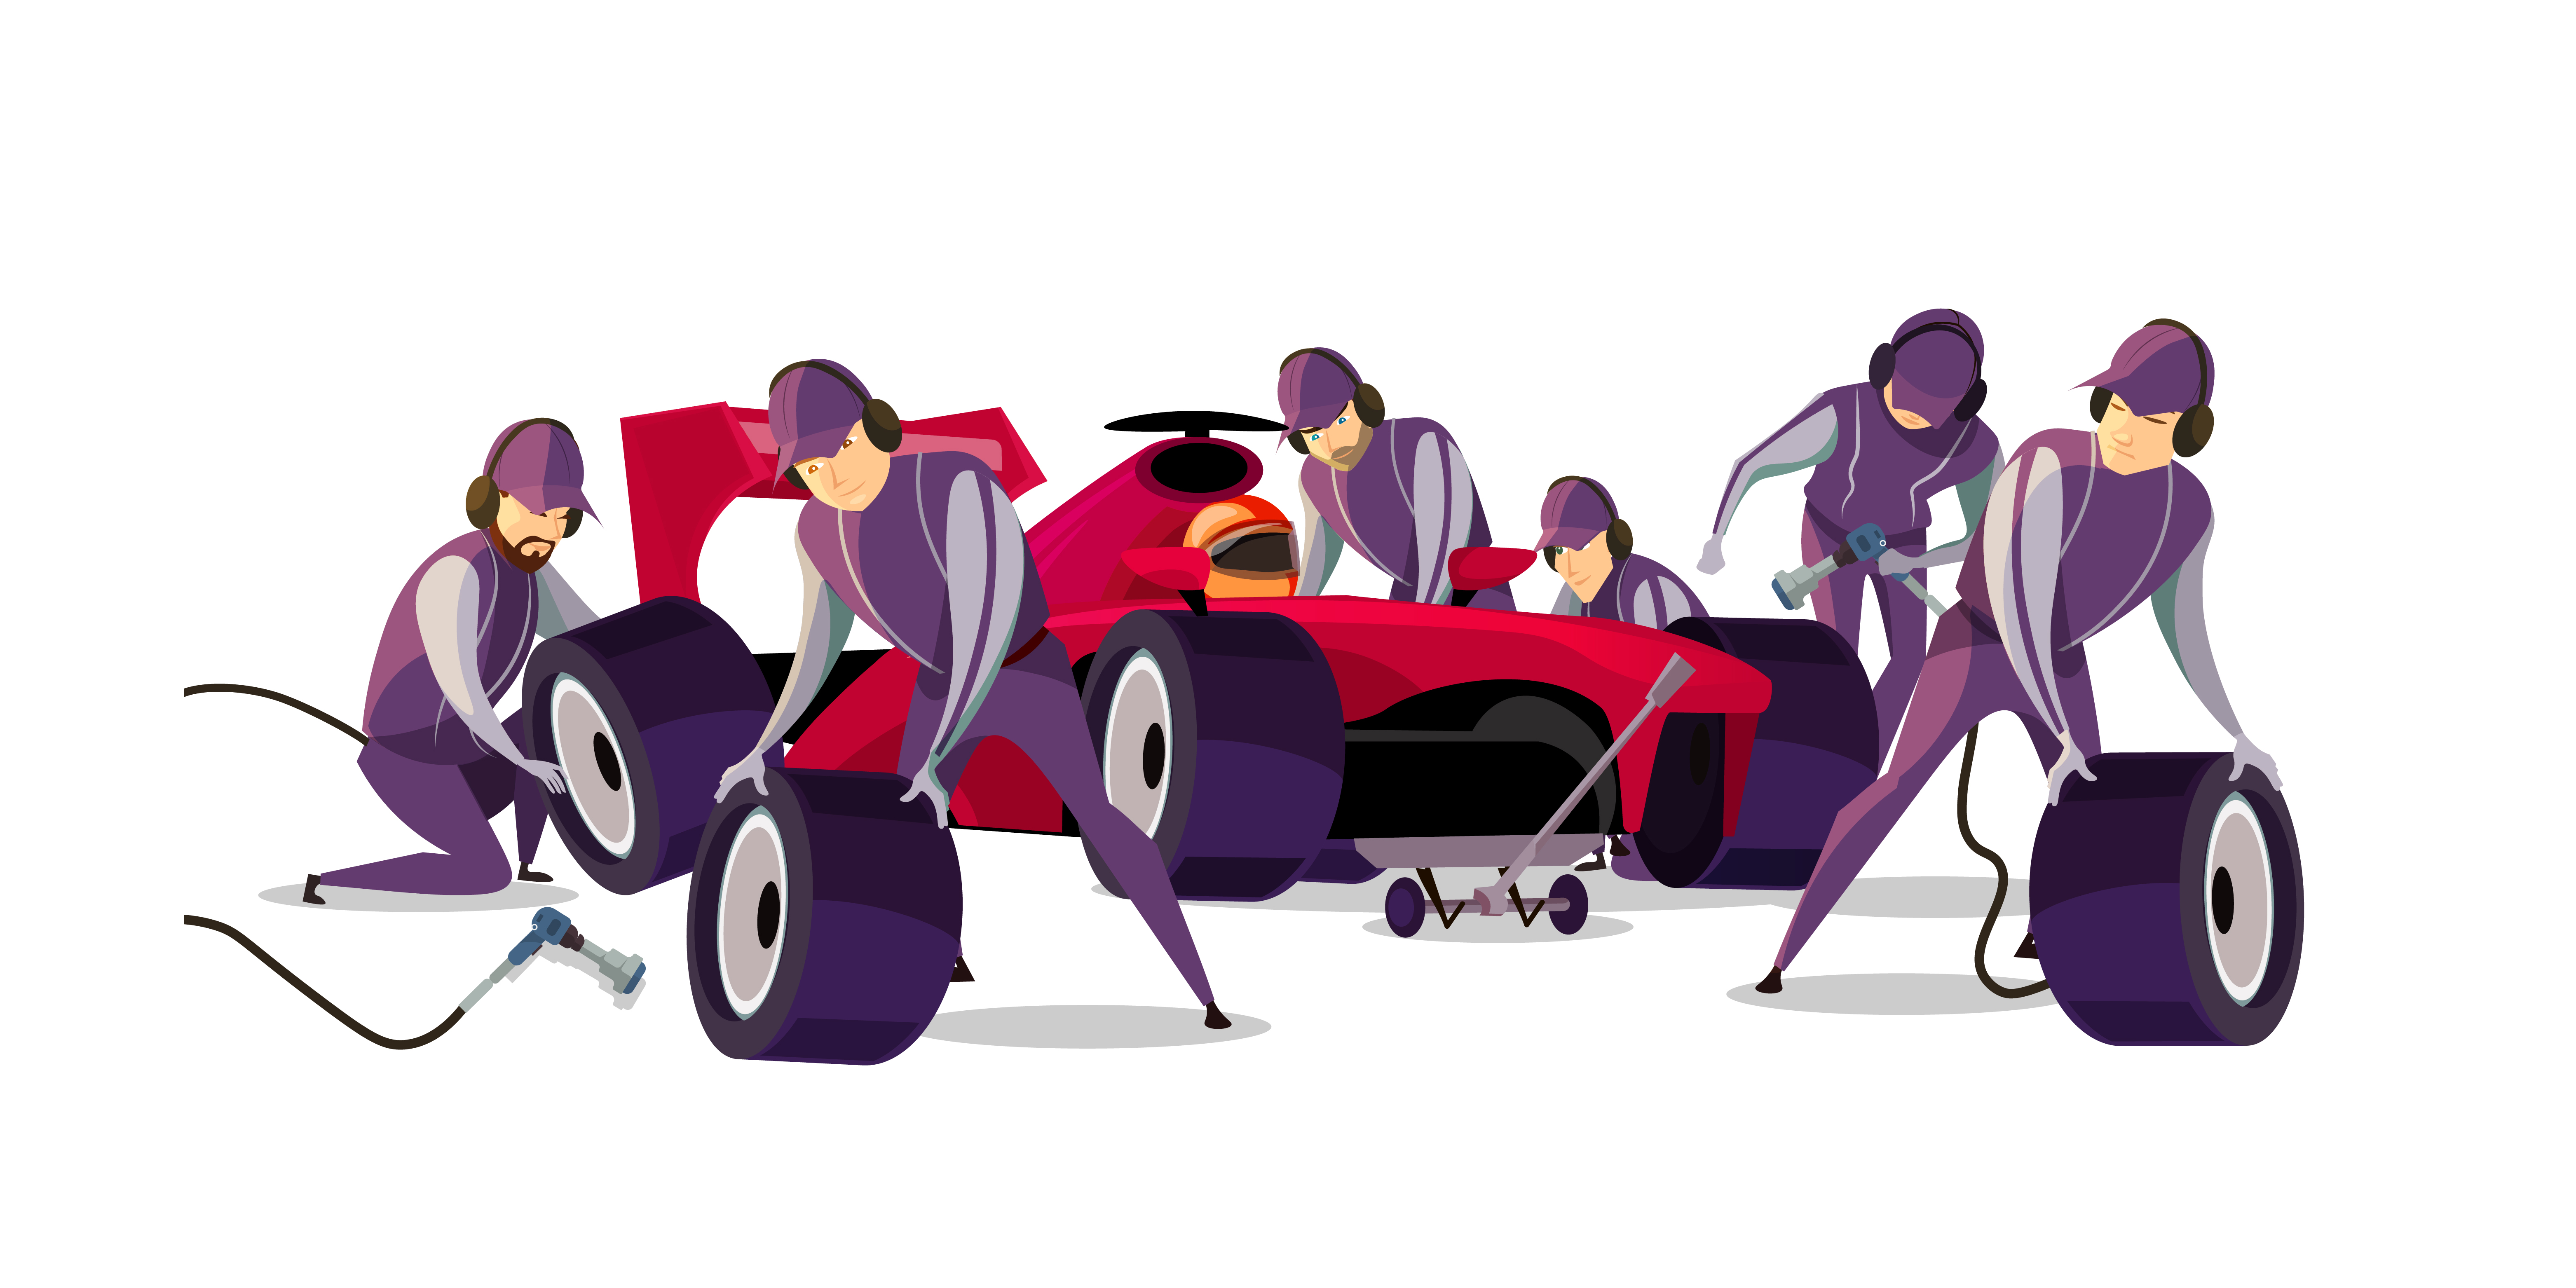
F1 strategy team at a pit wall
Pit wall
Strategy / data / decisions

THE OTHER RACE.

The people making the call before the car reaches the braking zone.

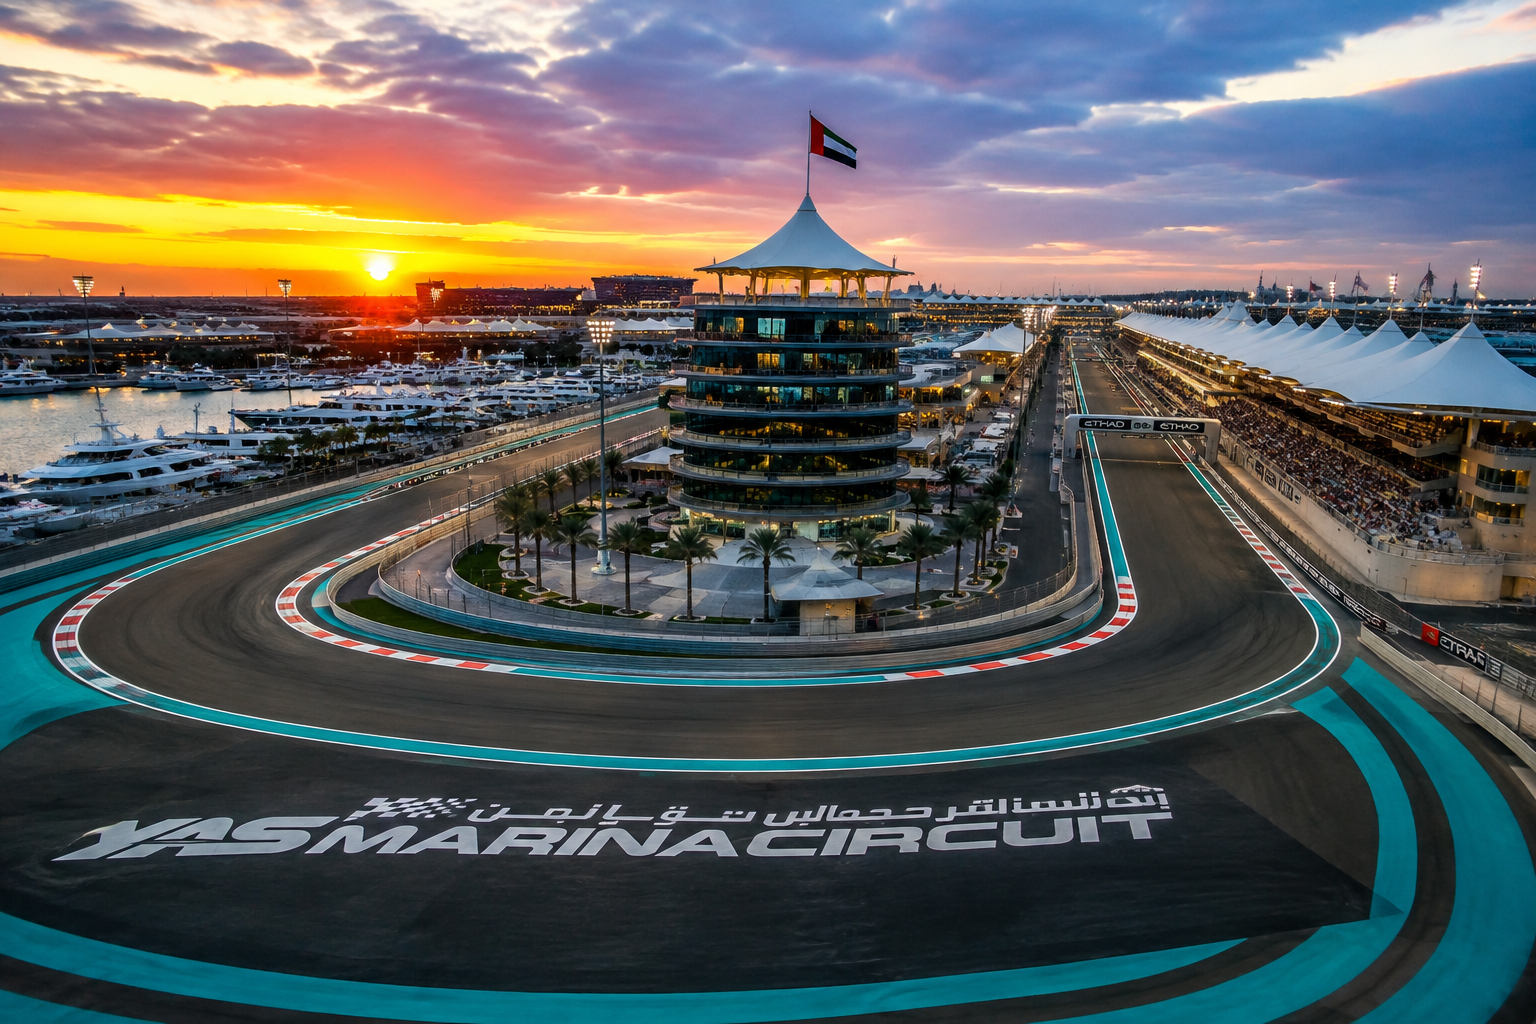
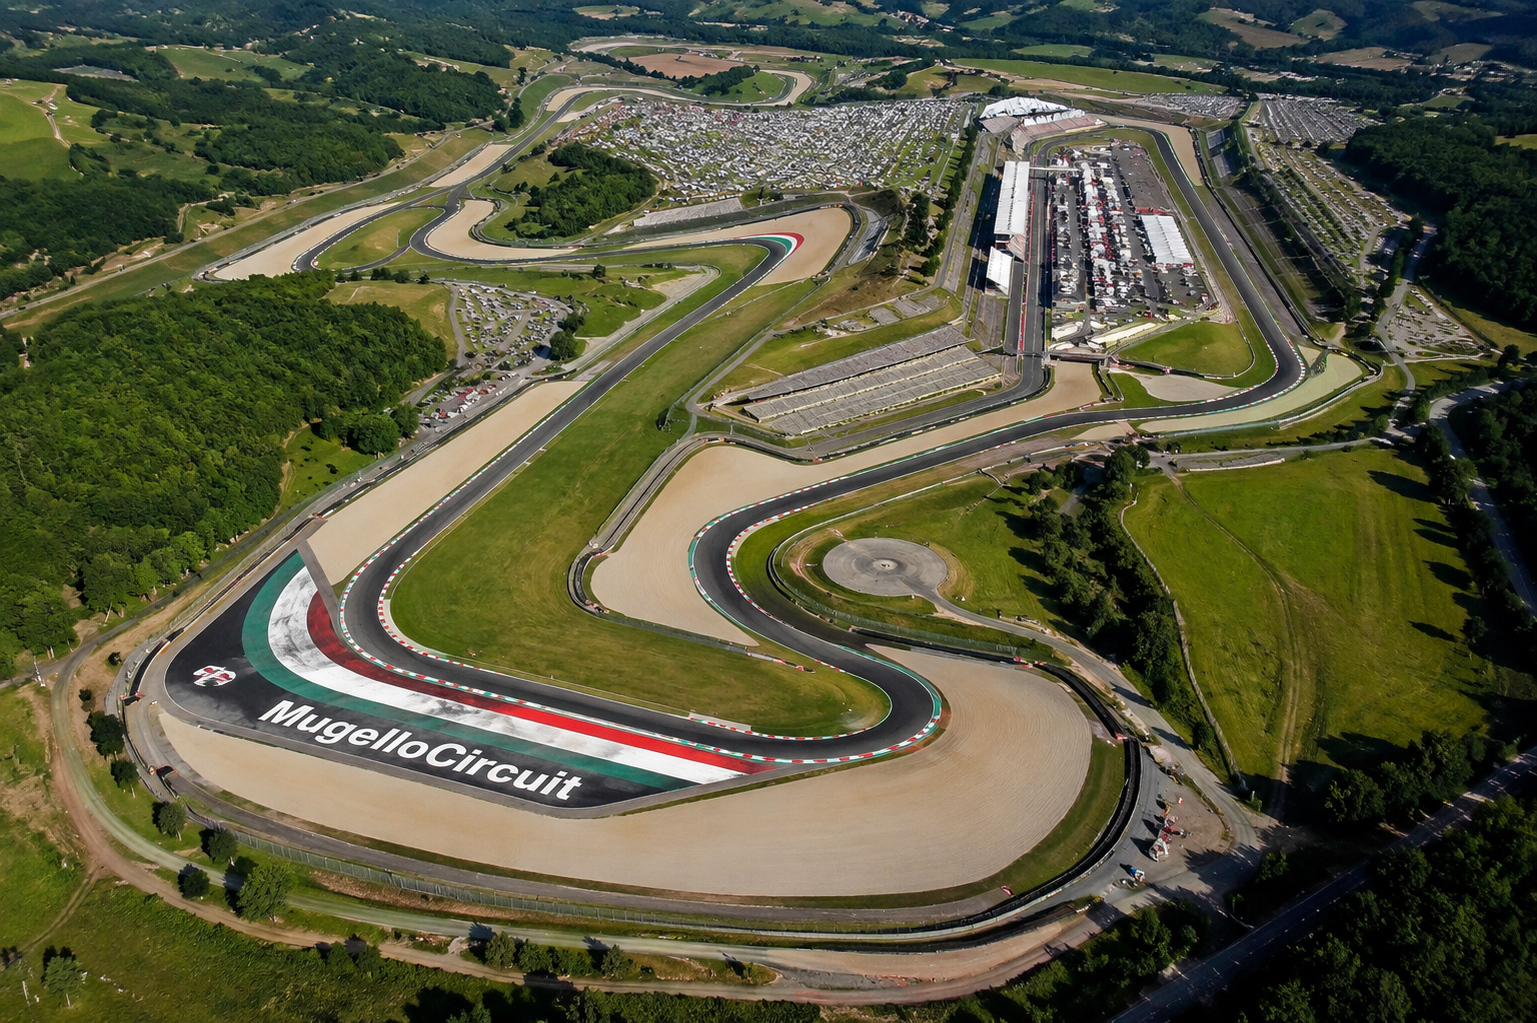
Aerial view of a Formula 1 circuit
Aerial / circuit 01 / 04
Circuit as data

EVERY CURVE HAS A STORY.

Race track scene
01
APEX
Motorsport inspired detail
02
SPEED
Performance car detail
03
MACHINE
High performance automotive detail
04
MOMENT
05 / Head to head

DUEL
THE DATA.

A comparison surface designed like a fight poster: two drivers, five measurable dimensions, one clean read.

Open H2H
Driver A
MAX
Red Bull Racing · #1
Race pace96
Qualifying94
Tyre management93
H2H MODEL 0.8s window
MAX LANDO
59%
41%
PACE
QUALI
TYRE
START
TRACK
Composite score built from race-form, qualifying pace, tyre behaviour, starts and circuit fit.
Driver B
LANDO
McLaren · #4
Race pace91
Qualifying93
Tyre management89
06 / Circuit intelligence

TRACE
THE LINE.

Stop treating the circuit as decoration. See the actual track, then layer speed, braking, tyre load and overtaking behaviour around it.

Circuit length
4.259 KM
Race distance
306.648 KM
Open track analytics
Aerial view of Circuit Zandvoort Formula 1 race track
F1 circuit / Zandvoort
Zandvoort / Netherlands

THE CIRCUIT IS THE STORY.

Aerial imagery sourced from Wikimedia Commons; the live F1 information page confirms Zandvoort as the Dutch Grand Prix circuit and lists its 4.259 km length and 72 laps. citeturn500580search0turn641100search11

07 / Intelligence feed

KEEP
PACE.

All predictions
Performance vehicle detail
Strategy note

WHY PACE DOESN’T TELL THE WHOLE STORY.

A fast car can still lose a race when the tyre and traffic picture turns against it.

View analysis
High performance car
Analytics

THE CIRCUIT IS A VARIABLE.

Every track changes which strengths are amplified and which weaknesses become visible.

Explore analysis
Automotive performance scene
Community

THE BEST PREDICTIONS ARE EXPLAINED.

Turn your call into a thesis and learn where other predictors see the race differently.

Join the action
Your race starts before lights out

MAKE
THE CALL.

Move from spectator to strategist. Explore the data, make a prediction, and see how your thesis stacks up.

*Illustrative homepage metrics and media placeholders can be replaced by backend/API data.